Background
The WiDS Datathon is an annual competition hosted by Women in Data Science. This particular dataset was created in collaboration with Climate Change AI (CCAI) and Lawrence Berkeley National Laboratory (Berkeley Lab). The mandate was to analyze differences in building energy efficiency, creating models to predict building energy consumption. Variables included building characteristics and climate and weather variables for the regions in which the buildings are located. The benefits of making accurate predictions of energy consumption are to help policymakers target retrofitting efforts to maximize emissions reductions.
My Approach
I participated in this Datathon because I wanted to work with a dataset that was connected to the environment. I also wanted to learn how to deal with missing values, and how to select the most salient features to improve predictive power. You can view the full notebook here.
- Understand Missing Values
- Impute Missing Values
- Feature Engineering
- Select Features
1. Understand Missing Values
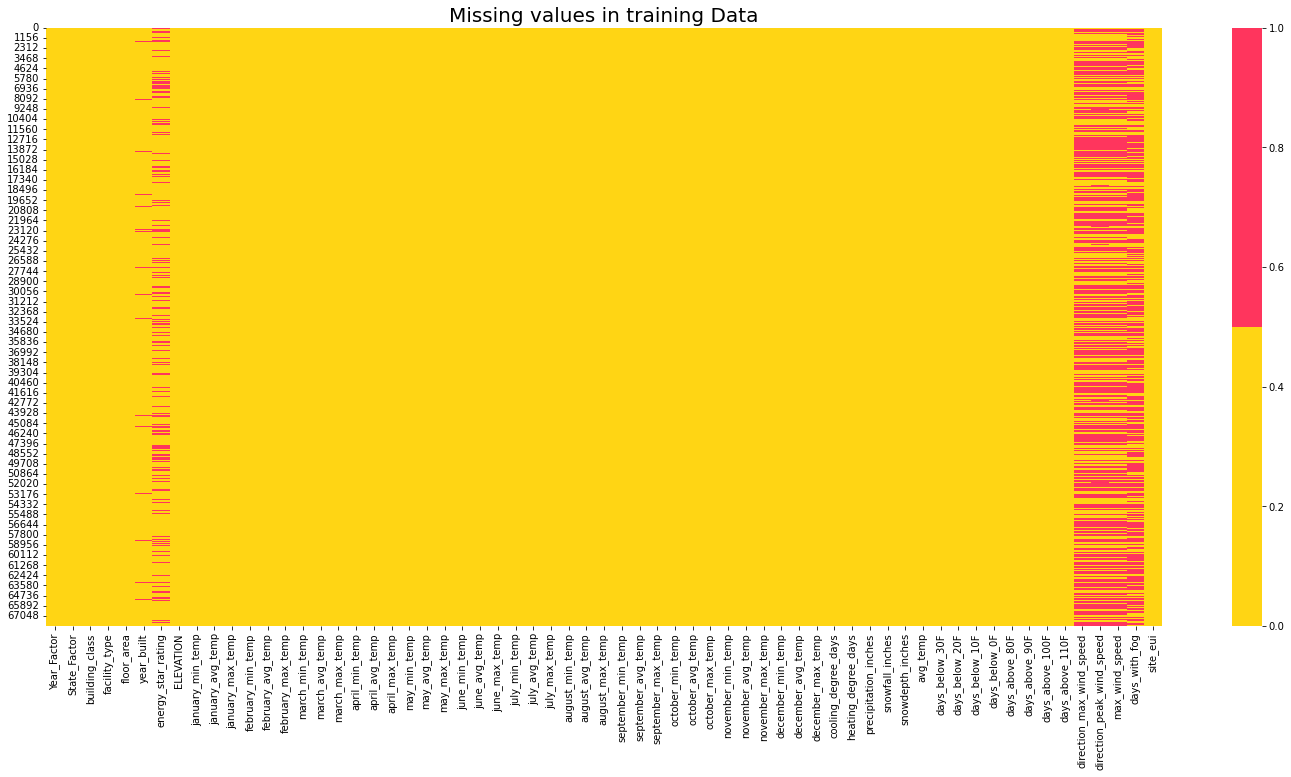
In this section I wanted to get a bird’s eye view of the missing values in the dataset. I used code from participating notebooks to visualize the missing values and understand the relationship between missing values and all other variables. I found that Energy Star Rating was missing 35% of total values and had the highest correlation to my target variable, site_eui (Energy Usage Intensity).
Missing values in training data
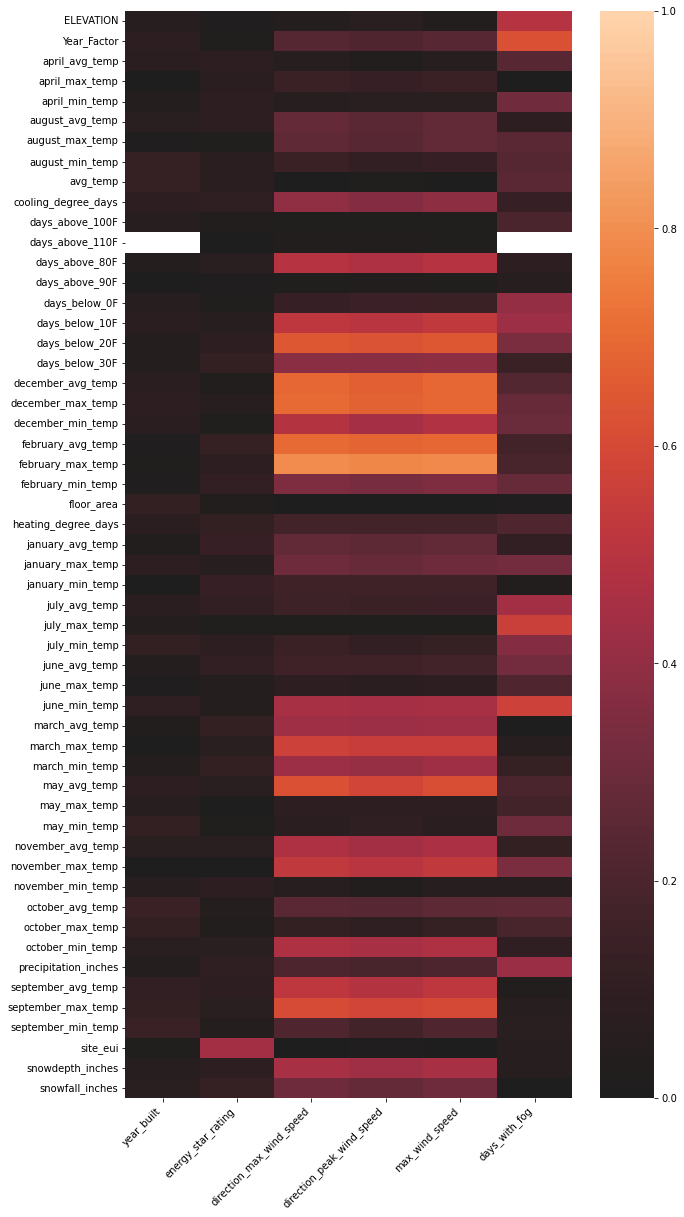
How are missing values correlated to other variables?
2. Model to Impute Missing Values
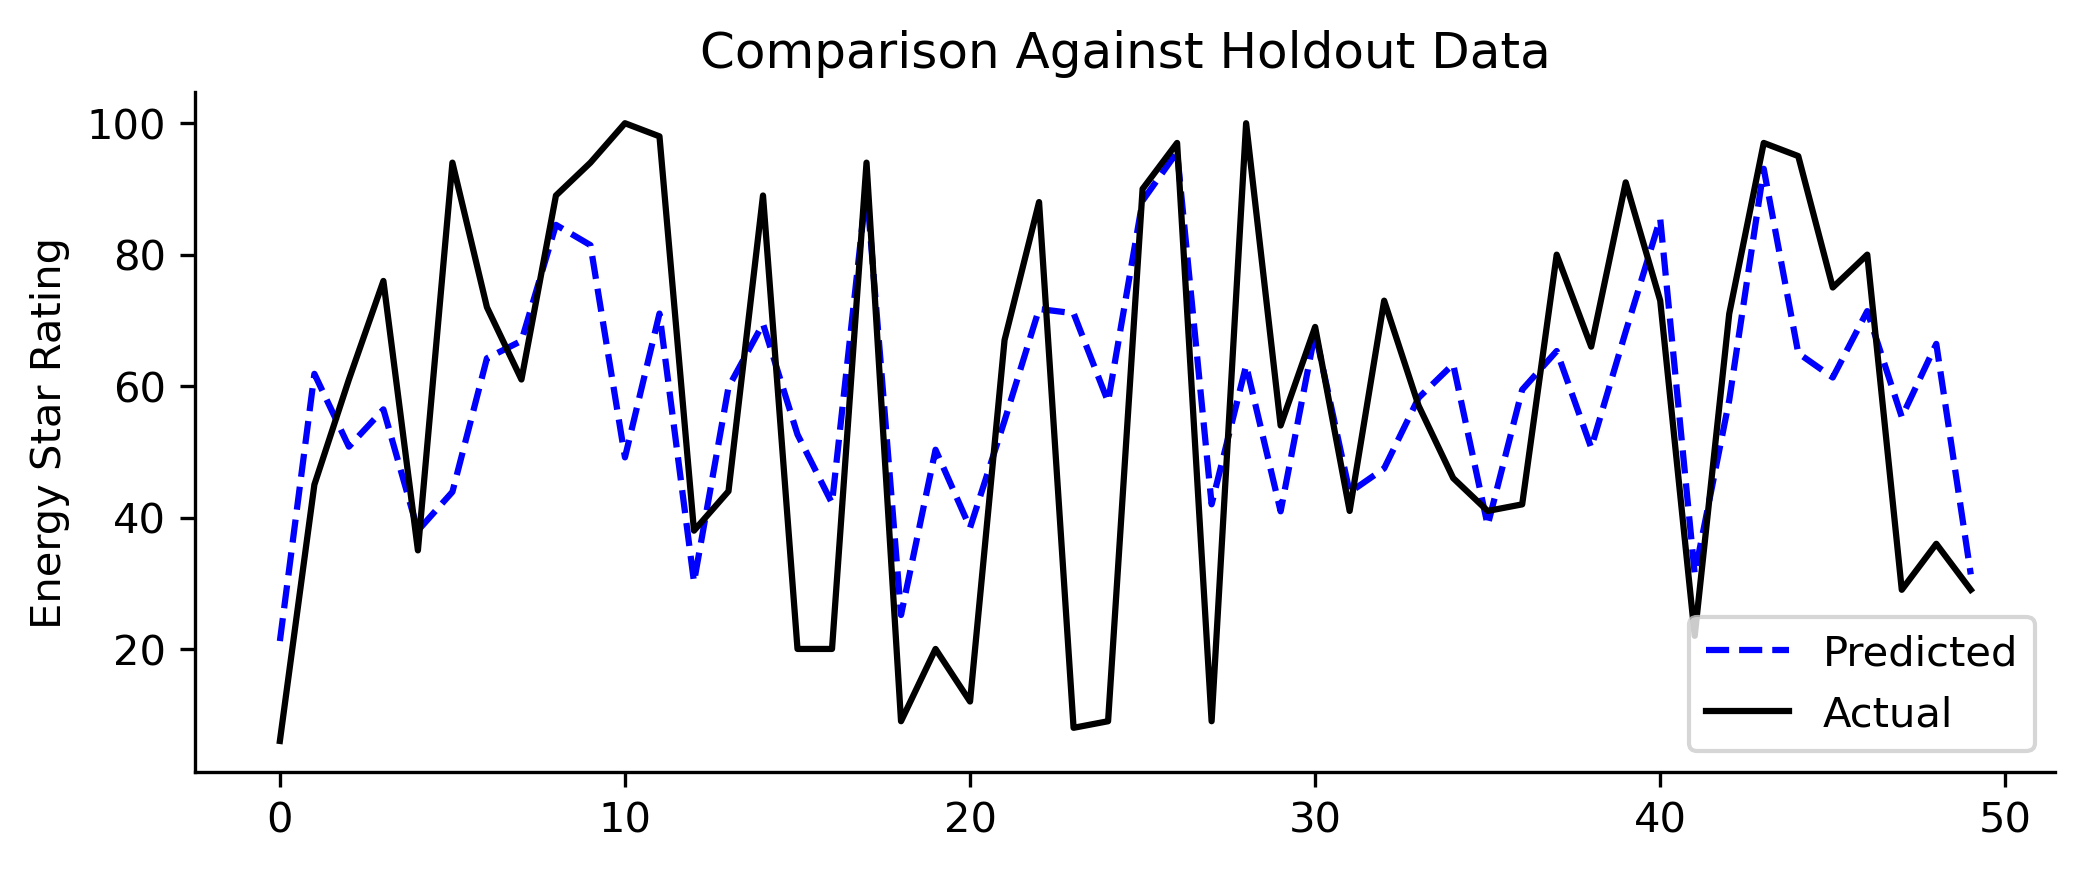
Since Energy Star Rating was highly correlated to our target variable site_eui, I created a model to impute the missing values instead of using something like Simple Imputer.
I imputed Energy Star Rating for the whole train set and not inside the cross validation loop as it would have been computationally expensive. I compared predictions against a holdout set. The results were better than using Simple Impute median values (23% lower RMSE; reduction from 29.56 to 22.73).
Missing Value Model Predictions vs Holdout Data
3. Feature Engineering
I created several features using the existing dataset. One of the engineered features with the most predictive power was the site_eui lag, i.e, the site_eui of a building from previous years. Credit for this feature goes to the winning team. Several of the other engineered features also had high contributions to the predictions.
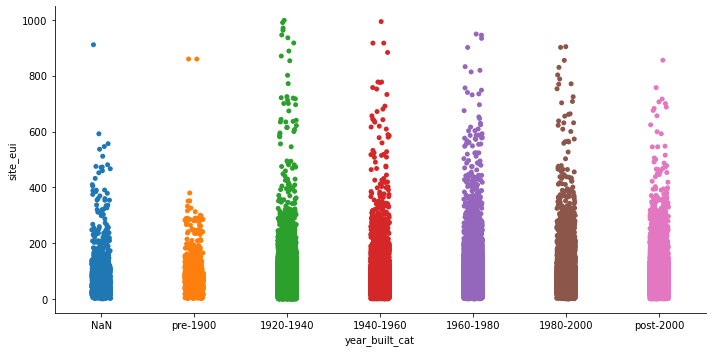
I visualized some of the features below:
Categorizing Building Age
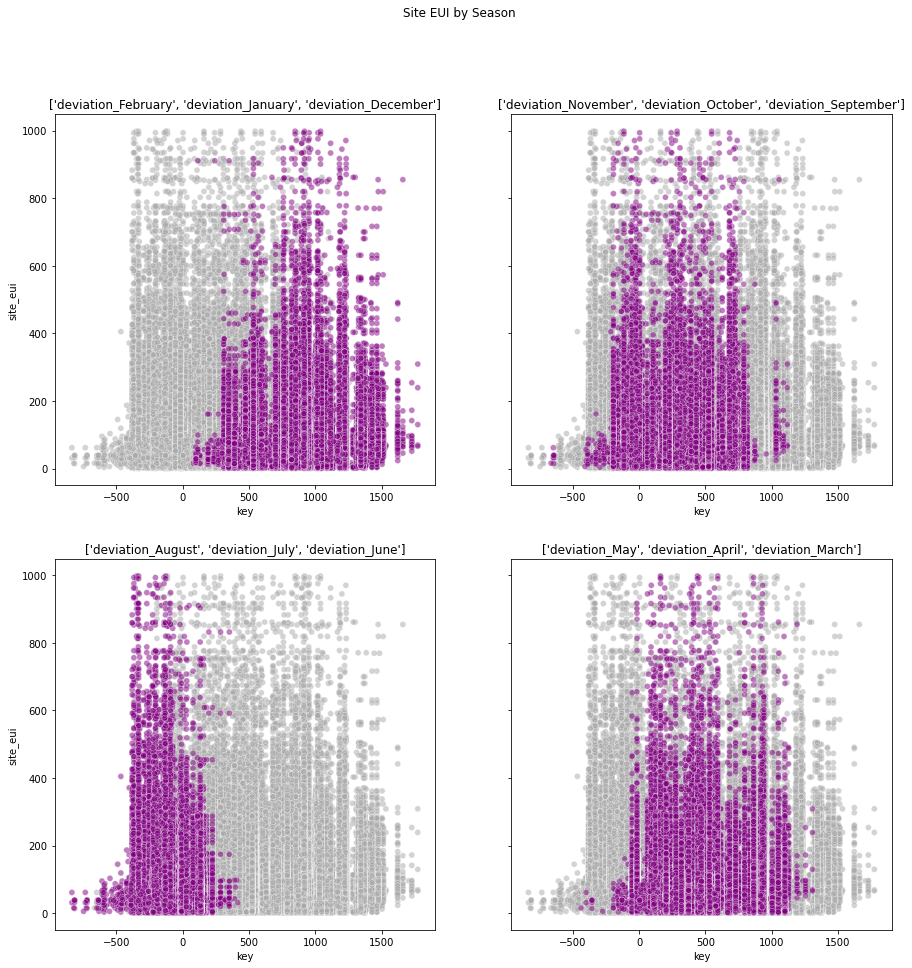
Deviation from Room Temperature for every month
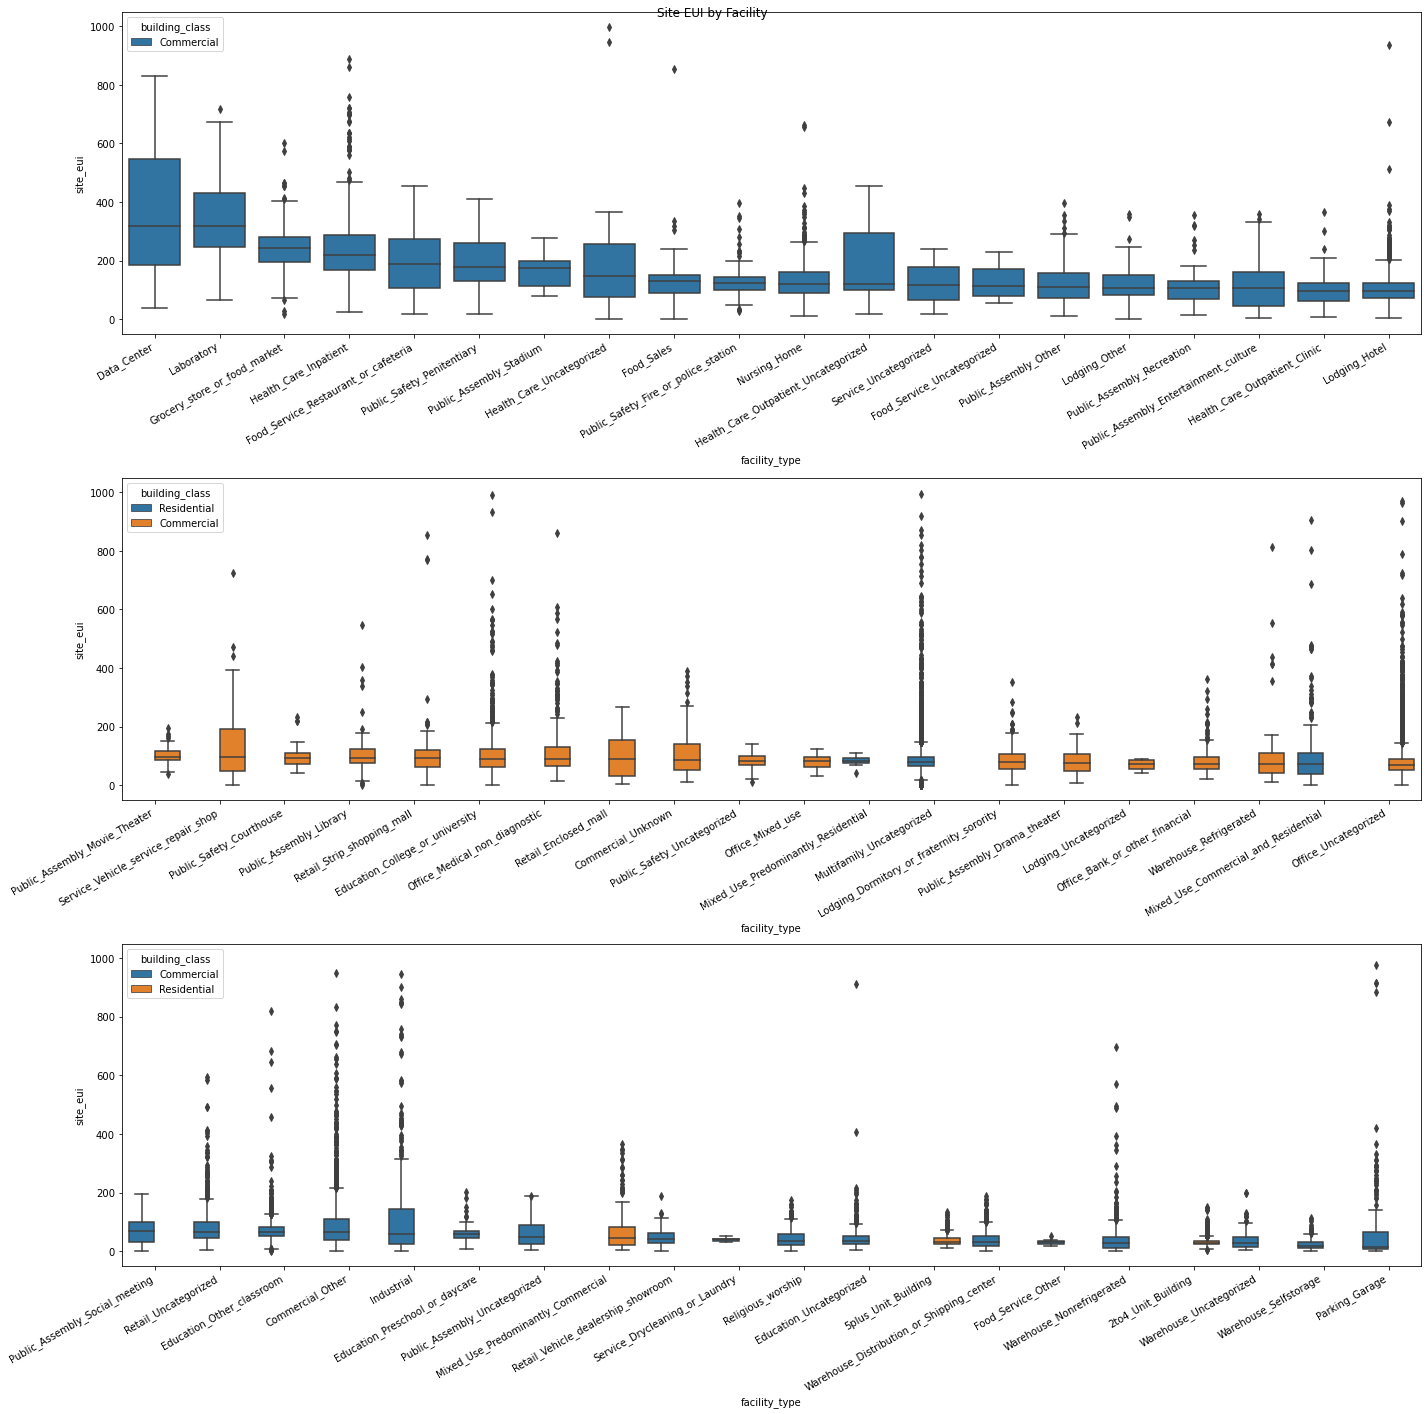
Categorization of Facility Type by Median Site EUI
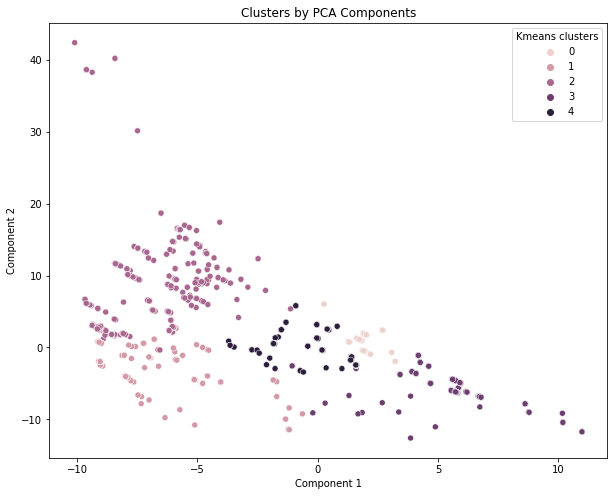
Creating Building Clusters using PCA and K-Means Clustering
4. Select Features
Finally, I created a cross validation loop to select features. I used the Catboost algorithm to train my model and obtained the shapely values using SHAP. The steps for each iteration were as follows:
- Generate new features for my train and validation set.
- Train the model on all features.
- Obtain the shapely values for the validation set.
- Select only those features that had an absolute shapely value of >0.2.
- Retrain the model on selected features.
- Predict validation set and calculate RMSE of validation set.
After this loop I selected the features that were chosen in at least 3 iterations – stable features that were the most predictive of my target variable site_eui.
Results
Prior to any feature engineering and selection, my score (RMSE) on the Kaggle competition page was 40. After generating new features and selecting through a comprehensive cross-validation loop, I was able to reduce my RMSE to 30 (a reduction of ~25%). Although far from perfect, it was a good learning process to understand the steps involved in a major data science project.
If you have any suggestions, I would love to hear them. See you in the next post!